Scroll Up Top
Download icon
Download

Monthly Review
March was defined by a sharp escalation in geopolitical risk and a corresponding repricing across rates, energy, and credit markets. The ongoing conflict involving Iran remained the dominant macro driver, shifting investor focus away from prior themes such as AI-driven disruption toward inflation risk, growth implications, and potential supply shocks in global energy markets.

The most immediate transmission channel was energy. Oil prices rose materially during the month, reaching levels around $110 per barrel, with intramonth spikes higher, as markets priced the risk of disruption to key shipping routes such as the Strait of Hormuz and potential damage to Gulf energy infrastructure. This repricing embedded a meaningful geopolitical risk premium into energy markets and raised concerns about second-order effects on inflation and growth.

Rates markets experienced a significant and broad-based repricing. Global 10-year yields rose sharply, with the U.S. 10-year increasing 38 basis points (bps) to 4.32%, the UK up 68bps to 4.92%, and Germany up 36bps to 3.00%. This move was accompanied by a bear flattening of curves, with U.S. 2s10s flattening by 4bps and 5s30s flattening by 14bps, reflecting a shift in expectations toward tighter policy and higher term premia. Inflation expectations also moved higher, with U.S. 10-year breakevens rising 5bps to 2.31%, reinforcing the inflationary implications of elevated energy prices.

This repricing reflected a sharp shift in central bank expectations. The market removed pricing for multiple Fed cuts, while European policy expectations turned more hawkish, with the European Central Bank now pricing a more restrictive stance and the Bank of England facing renewed pressure given its inflation backdrop and energy exposure. As a result, positioning built around steep curves and carry-driven strategies was disrupted, leading to adjustments across portfolios.

Credit markets remained relatively resilient in aggregate, though spreads moved wider and dispersion increased. U.S. investment grade (IG) spreads widened modestly by 5bps to 89bps OAS, supported by strong technicals including fund inflows and low dealer inventories. In contrast, Euro investment grade underperformed more materially, widening 14bps to 97bps OAS, reflecting greater macro sensitivity and weaker supply dynamics. Within IG, widening was more pronounced in lower-quality segments, with BBB spreads widening 6bps in the U.S. and 17bps in Europe.

At the same time, dispersion within IG remained elevated. M&A activity in sectors such as food & beverage and healthcare/pharmaceuticals contributed to idiosyncratic spread moves, while AI-related concerns continued to weigh on parts of the market. Some individual issuers tightened by 10–20bps during March, though these names generally remain 20–40bps wider year-to-date, underscoring that improvements have been selective rather than broad-based.

High yield markets experienced greater volatility. U.S. high yield spreads widened 26bps to 317bps, while Euro high yield widened 53bps to 332bps, with dispersion across sectors driven by both macro and idiosyncratic factors. Energy outperformed amid higher oil prices, while more cyclical sectors such as airlines lagged. Lower-quality segments underperformed meaningfully, with CCC spreads widening over 100bps in both regions.

In leveraged loans, performance stabilized following earlier weakness, particularly within software, which had been under pressure due to AI-related concerns. CLO issuance remained robust, with Q1 volumes tracking toward annualized levels consistent with the prior year, even as retail outflows persisted and managers reduced exposure to more vulnerable sectors.

Securitized markets experienced volatility primarily driven by rates. Agency MBS yields rose sharply (up ~56bps), while spreads widened modestly before partially retracing. Credit-sensitive securitized sectors saw more contained moves, with AAA spreads widening only 4–6bps, broadly returning to levels seen at the start of the year. Despite rate-driven volatility, funding conditions remained orderly.

Emerging markets reflected the broader macro repricing. EM external spreads widened ~25bps, with larger moves in high yield (+42bps) and regional dispersion across Africa (+55bps) and Europe (+44bps). Local rates also sold off meaningfully, with front-end yields in some markets rising 75–150bps, while currencies broadly weakened against the U.S. dollar, which appreciated ~2.4% over the month.

Municipal markets also adjusted to the higher rate environment, with intermediate ratios moving closer to historical averages, while the long end remained relatively well supported.

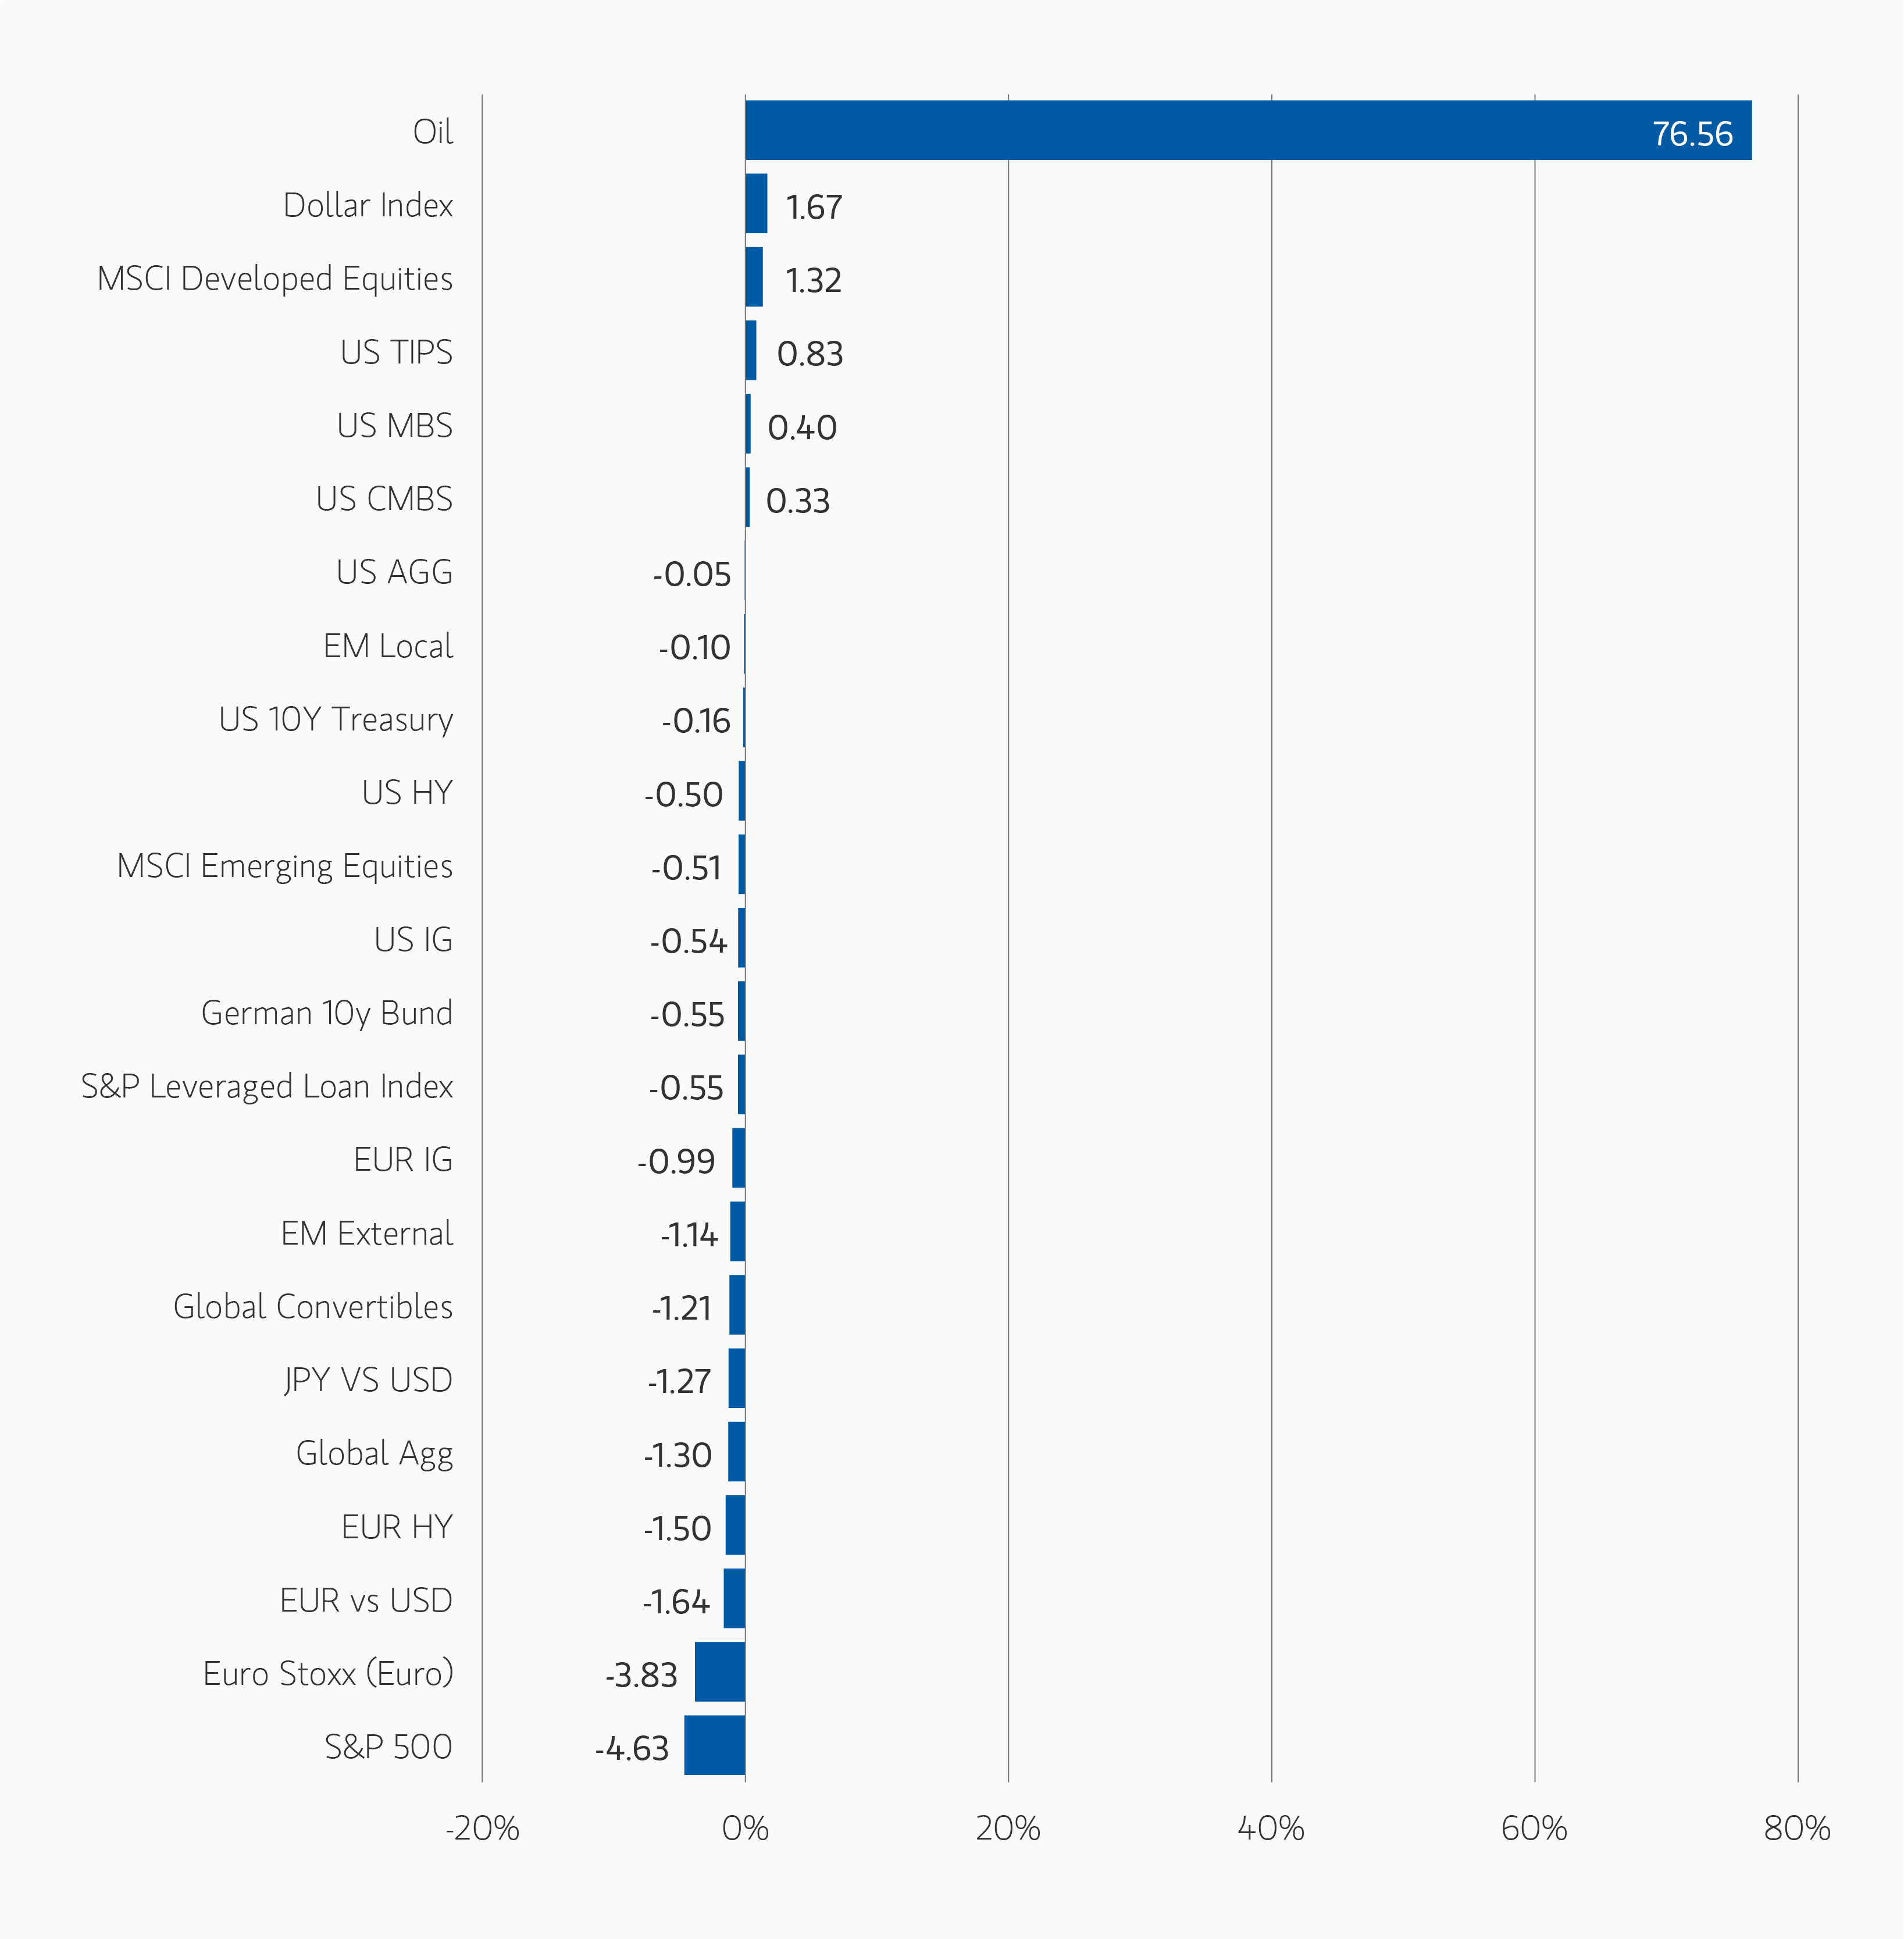
Asset Performance Year-to-Date

DISPLAY 1
insight_shock-then-repricing_display1.png

Note: USD-based performance. Source: Bloomberg. Data as of March 31, 2026. The indexes are provided for illustrative purposes only and are not meant to depict the performance of a specific investment. Past performance is no guarantee of future results. See pages 6-7 for index definitions.

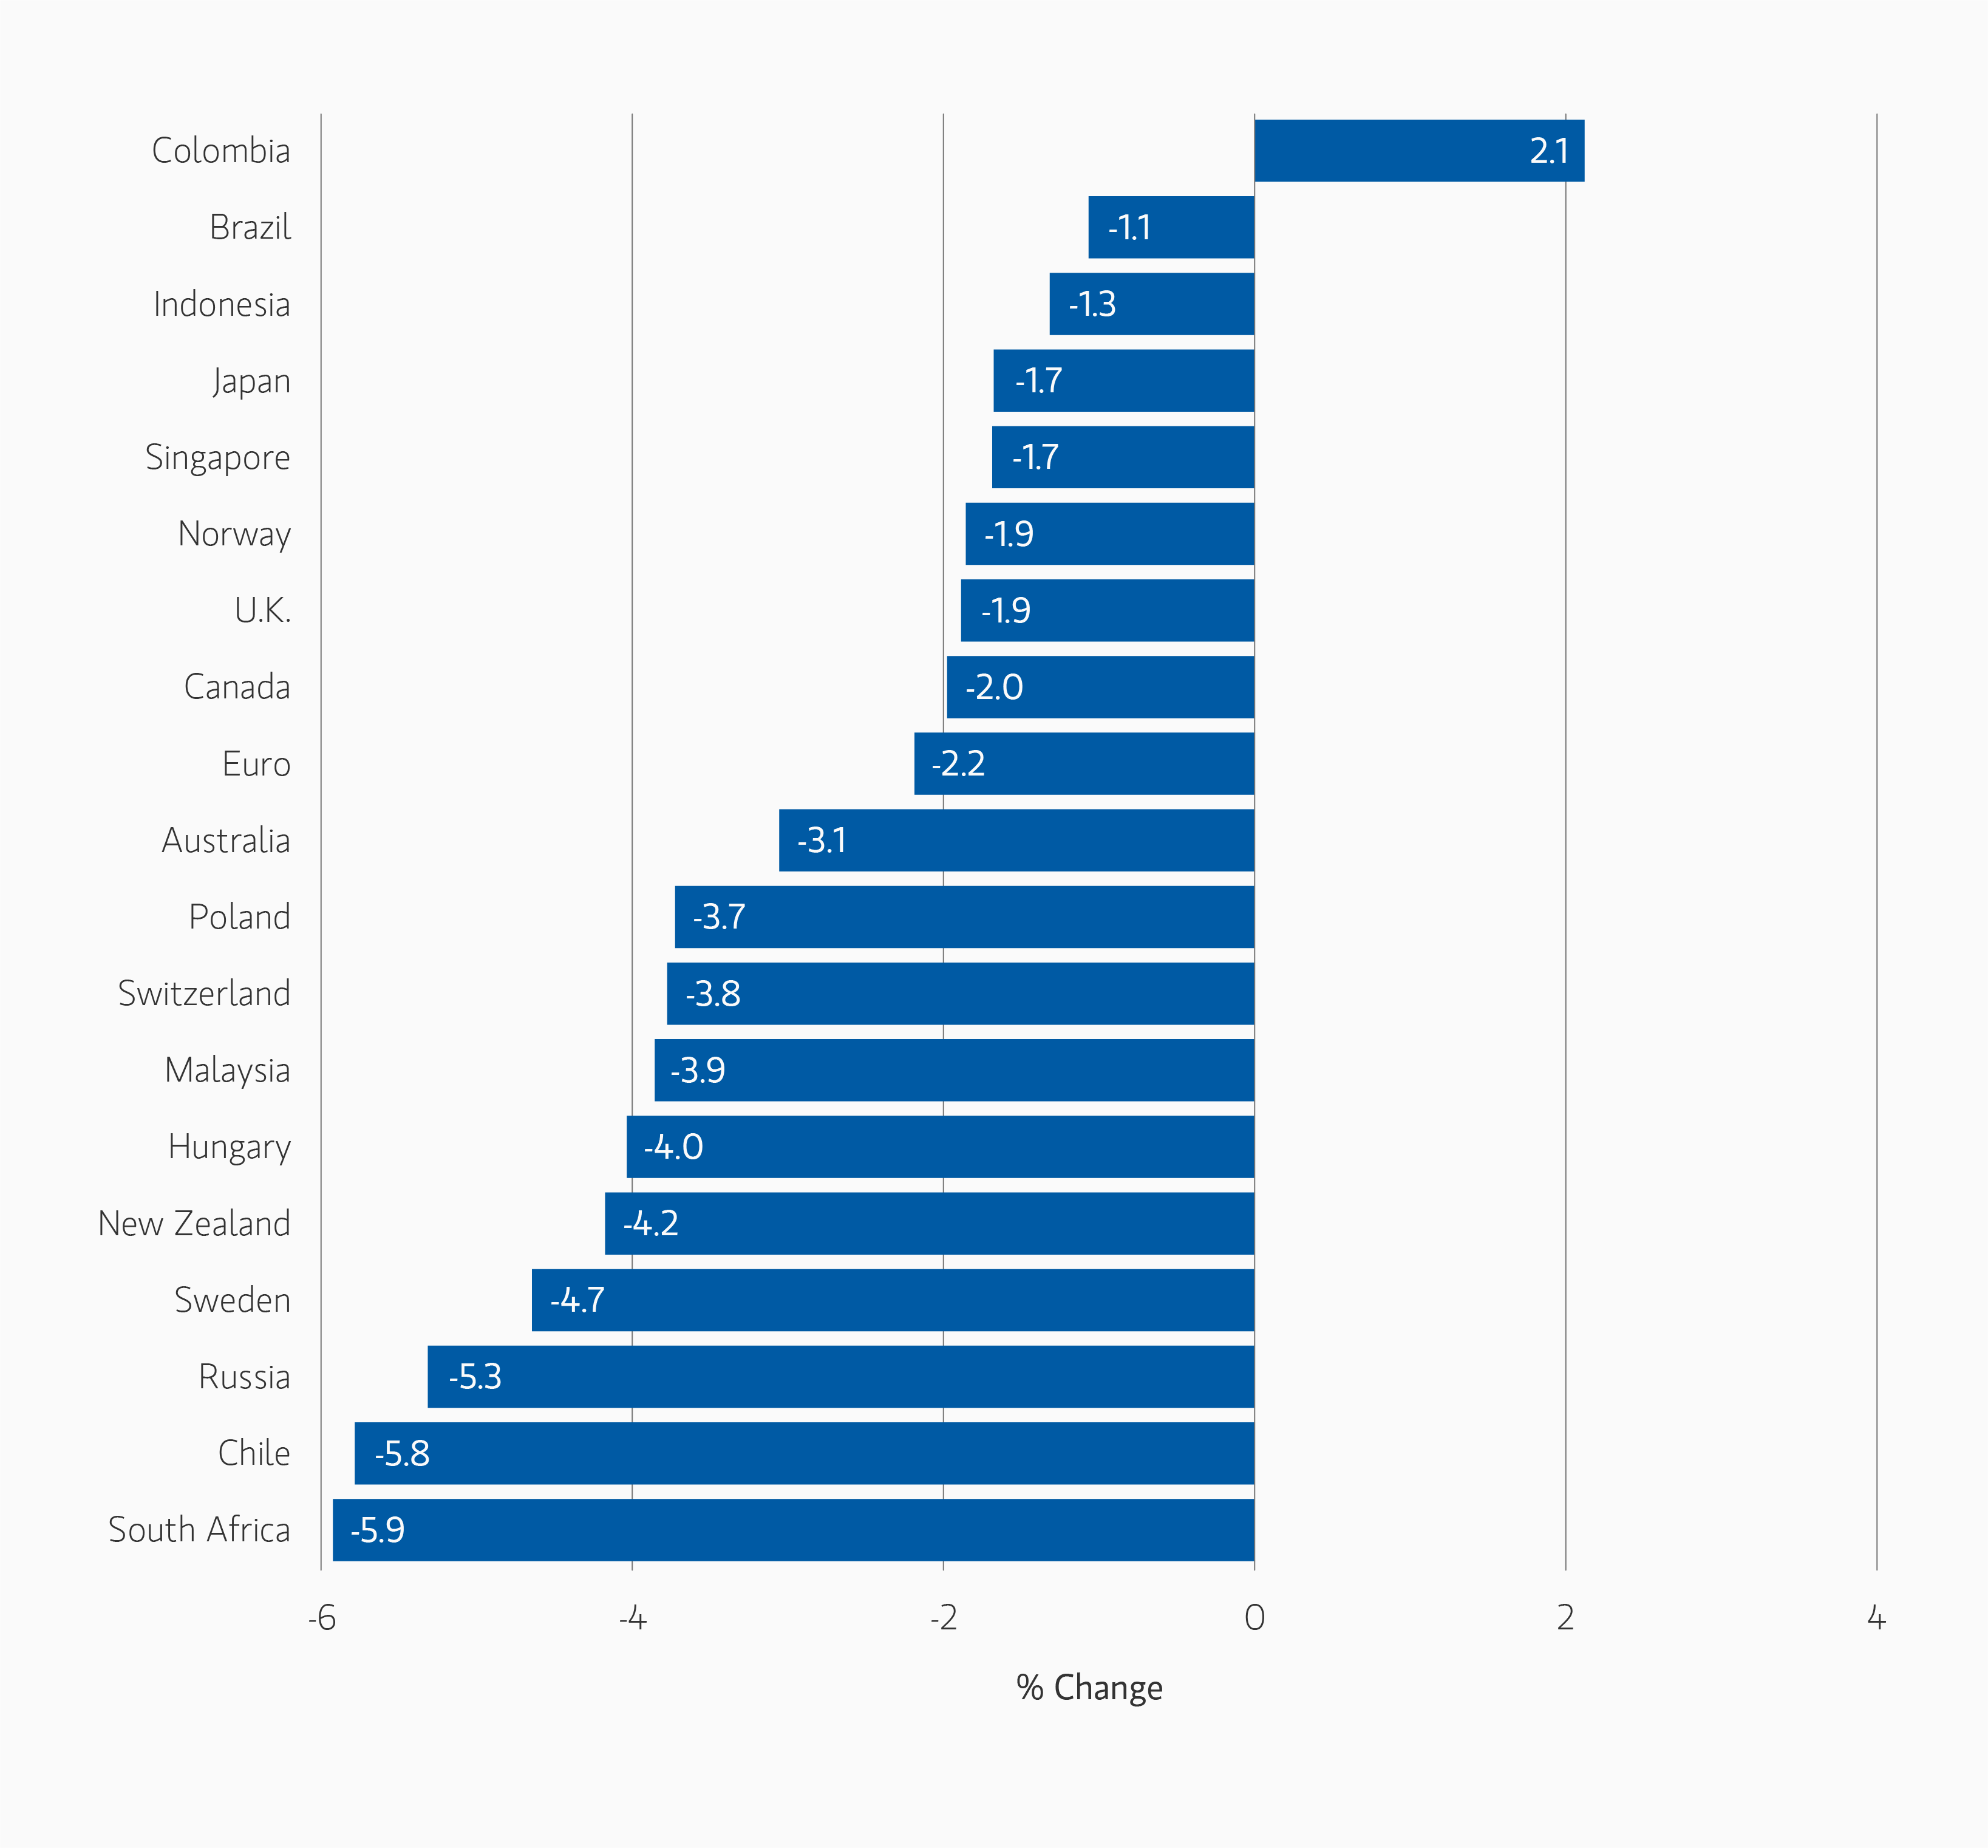
Currency Monthly Changes versus USD

DISPLAY 2
insight_shock-then-repricing_display2.png

Note: Positive change means appreciation of the currency against the USD. Source: Bloomberg. Data as March 31, 2026.

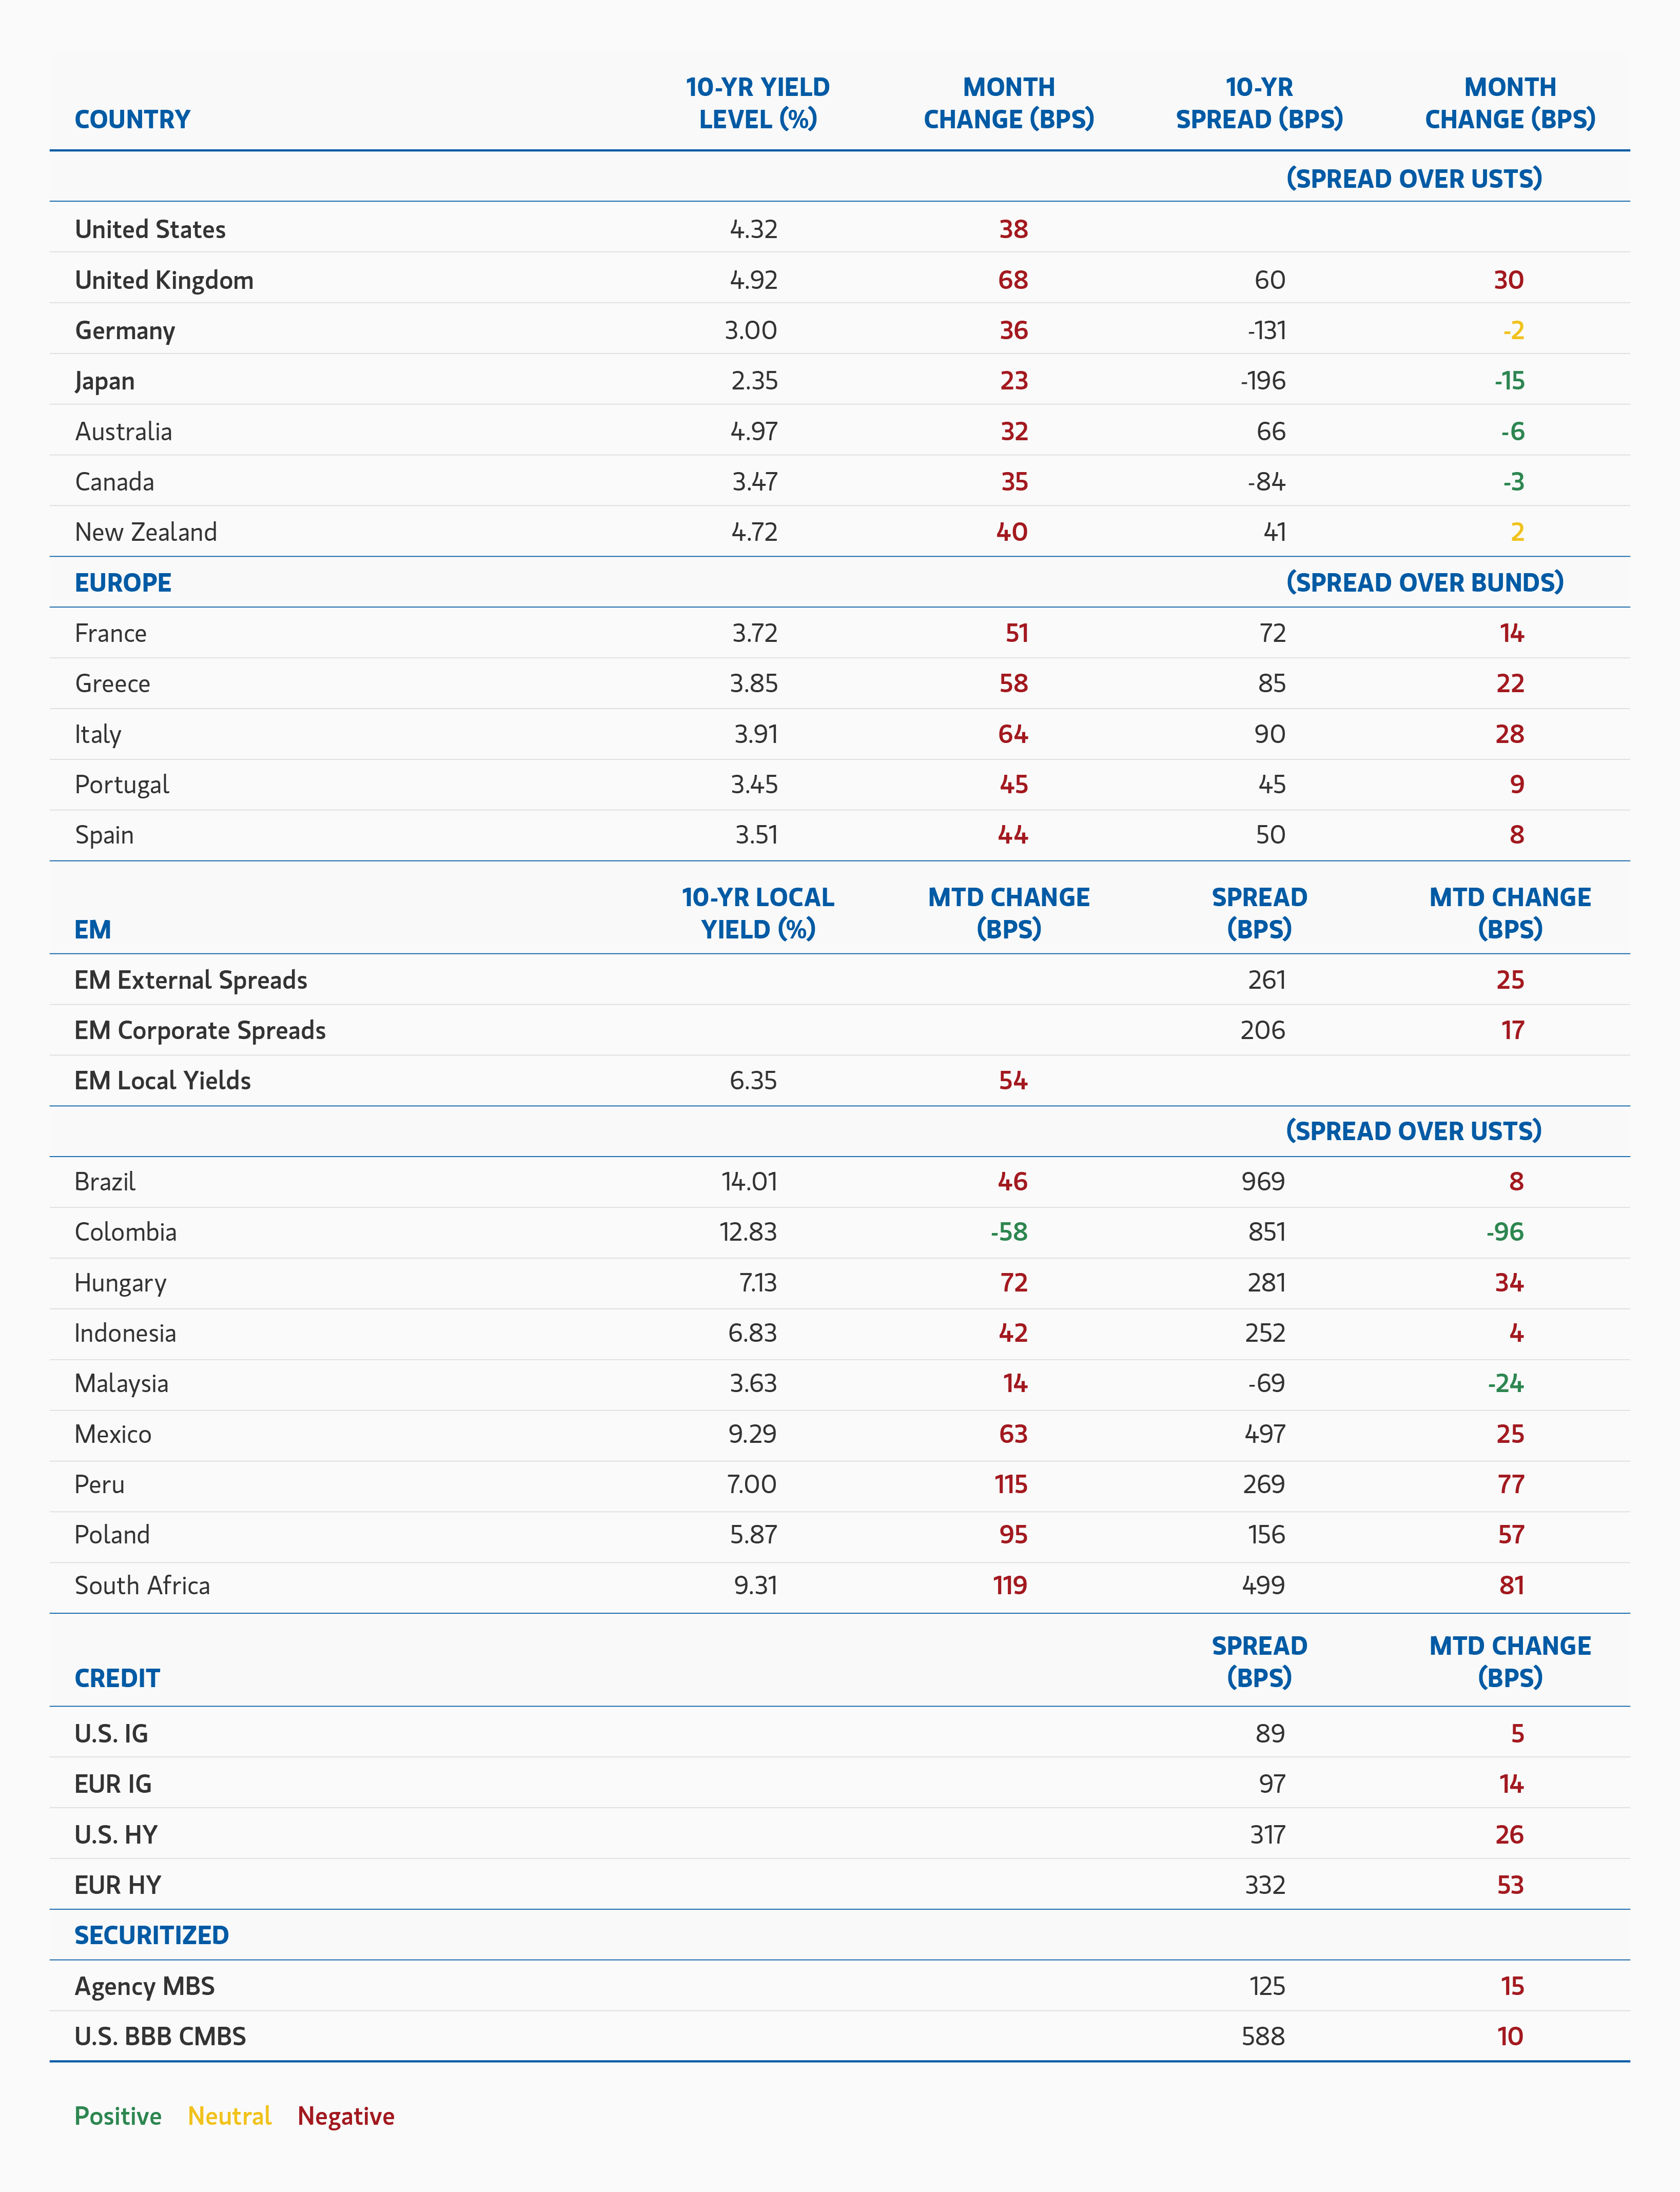
Major Monthly Changes in 10-Year Yields and Spreads

DISPLAY 3
insight_shock-then-repricing_display3.png

Source: Bloomberg, JPMorgan. Data as of March 31, 2026.

Broad Markets Fixed Income Global Asset Allocation and Outlook

Developed Market Rate/Foreign Currency
(Long duration, curve steepeners)
February’s duration rally proved short-lived, as March saw a sharp reversal driven by a repricing of inflation and policy expectations following the escalation of the conflict in the Middle East. While markets initially reacted defensively, the persistence of elevated energy prices shifted the focus acutely towards a stagflation risk, leading to a broad selloff in rates. Despite the spike in volatility, funding markets, cross-currency basis and market depth have remained orderly.

We believe the market is over pricing the inflation shock and central bank hawkishness and underpricing the growth shock. We used the spike in volatility and yields to extend duration across selective DM and EM government markets and are now at a long duration stance across our portfolios. Global yields have moved materially higher — with the U.S. 10-year yield breaking recent ranges and real yields approaching 2%. Expectations for rate cuts have been scaled back meaningfully, while in Europe the market now prices a more restrictive policy path from the ECB. Elevated oil prices and the risk of sustained energy-driven inflation remain key risks for the global duration outlook, although inflation markets continue to suggest that any near-term increase is likely to be transitory.

Curve dynamics have also shifted, with recent moves characterized by bear flattening following earlier
steepening. We are now neutral on curves, having exited steepening exposures.

Positioning reflects a preference for relative value across regions. Our longs in U.S. real yields and Canada are offset by short positions in Japan, where normalization dynamics and weaker technicals continue to differentiate the market. Positioning in Japan remains modest but reflects asymmetric risks to yields relative to other developed markets.

In foreign exchange, we remain cautiously constructive on high-carry non-oil importing currencies. While geopolitical stress and higher oil prices have supported the U.S. dollar in the near term, we expect this strength to be episodic rather than structural. We continue to express a positive view on select high-beta FX, particularly in markets that are more insulated from the terms-of-trade and growth implications of higher energy prices. These positions are expressed primarily against the euro and the U.S. dollar.

Emerging Market Debt
(Overweight)
Emerging market (EM) sovereign and corporate debt remains an attractive opportunity for 2026, even as recent geopolitical developments and the associated rise in energy prices have introduced a more volatile macro backdrop. The spike in geopolitics led market volatility has been another reminder of how EM is not a monolithic allocation but requires careful country selection. While dispersion across countries has increased, broader EM funding conditions have remained orderly, and capital flows continue to differentiate among issuers rather than retreat indiscriminately. In this environment, carry and income remain central drivers of expected returns, though macro developments are playing a more prominent role in near-term performance.

Elevated real yields, and credible reform momentum across several countries continue to underpin a supportive backdrop. Valuations — particularly in local markets — remain attractive, and many EM currencies are still undervalued relative to the U.S. dollar. However, recent market moves have highlighted increased sensitivity to global rates and energy dynamics, with front-end yields rising in several markets and currencies experiencing periods of volatility and intervention.

The rise in oil prices has further increased divergence across the asset class, benefiting commodity exporters while posing headwinds for energy importers. As a result, dispersion across countries remains high, reinforcing the importance of policy discipline and country selection. We continue to favor markets with credible monetary frameworks, improving fundamentals, and attractive real yield differentials versus developed markets, while remaining mindful of geopolitical risks, commodity sensitivity, and evolving global policy expectations.

Corporate Credit
(More underweight IG, small overweight HY)
Our base case remains cautiously constructive for credit, even as uncertainty has increased following the escalation of the conflict in the Middle East. This view is supported by improved valuations, with spreads having decompressed from year-to-date tights, alongside expectations for low but positive economic growth and a correspondingly benign default environment. While geopolitical risks remain elevated, emerging signs of U.S. engagement aimed at de-escalation, combined with supportive fiscal policy, continue to underpin growth, employment, and consumption.

Investment grade spreads widened modestly during March, with U.S. IG moving to approximately the high-80bps range and Euro IG to the mid- to high-90bps range. While spreads remain below long-run averages, the recent widening has improved entry points, and valuations are broadly supported by strong corporate fundamentals and resilient demand for yield. At the same time, there remains limited evidence of a reactive shift in monetary policy to offset Middle East-driven inflation risks, despite markets pricing a more hawkish path for 2026.

Corporate balance sheets remain healthy as we move further into a late-cycle phase characterized by increasing M&A activity, AI- and infrastructure-related capex, and elevated shareholder distributions. This environment reinforces the importance of sector and security selection. Robust demand for the “all-in” yields offered by investment grade credit should help absorb the expected increase in issuance — particularly from non-financial corporates funding M&A and capex — though this also contributes to greater dispersion across issuers.

Given elevated geopolitical uncertainty, evolving policy expectations, and increasing idiosyncratic risk — particularly in sectors exposed to AI disruption — we have less conviction in material spread tightening from current levels. As a result, we expect carry and security selection to remain the primary drivers of return rather than broad-based multiple expansion. Regionally, we continue to prefer Europe over the U.S., supported by relatively more balanced supply dynamics and policy support.

We maintain a modest overweight to select high-yield issuers in both the U.S. and Europe. Fundamentals remain supportive, with improved average credit quality, low default rates, and manageable leverage. While spreads have widened modestly and volatility has increased, the higher carry, shorter spread duration, and continued dispersion across sectors create attractive opportunities for selective positioning. Recent market moves have reinforced the importance of quality bias and disciplined risk selection, but defaults are still expected to remain contained, supporting ongoing investor demand.

Leveraged Loans
(Underweight)
We expect heavier net supply and rising dispersion in leveraged loans. While CLO demand remains a key technical support, the asset class is increasingly characterized by greater selectivity, with managers adjusting allocations in response to evolving macro conditions and sector-specific risks. At the same time, retail flows have been more mixed, contributing to a more uneven technical backdrop.

Sector dispersion remains elevated. While software and technology-linked issuers have shown signs of stabilization following earlier weakness, structural concerns around AI-driven disruption continue to influence positioning, with CLO managers reducing exposure to the sector. More economically sensitive sectors are showing signs of strain, particularly in an environment of rising input costs and macro uncertainty.

Given the recent repricing of central bank expectations and higher rate volatility, the relative attractiveness of floating-rate assets has diminished. As a result, we maintain an underweight to the asset class, with a preference for selective exposure where fundamentals remain resilient and valuations adequately compensate for increased dispersion and macro risk.

Securitized Products
(Overweight)
Agency mortgage-backed securities (MBS) and non-agency residential mortgage-backed securities (RMBS) remain a high-conviction overweight for 2026. While agency MBS experienced periods of widening during March amid the broader rates selloff, securitized spreads remained relatively resilient overall, demonstrating stability even as volatility increased across rates markets. Agency MBS continue to offer attractive spread pickup relative to both historical levels and other core fixed income sectors, providing compelling relative value versus investment grade corporates and cash alternatives.

Recent market moves have been driven primarily by rates rather than credit fundamentals. Agency MBS yields increased materially alongside higher Treasury yields, while spread widening remained contained and partially retraced. More broadly, securitized funding markets have remained orderly, reinforcing the sector’s defensive characteristics within spread products despite elevated macro volatility.

Technical factors continue to play an important role in performance. Demand for high-quality collateral remains supported by money manager interest in carry, alongside a measured and predictable pace of Federal Reserve balance sheet runoff that has limited net supply pressure. The recent increase in yields has also improved entry points, allowing for selective addition of risk where valuations have become more attractive.

Non-agency RMBS continues to offer an attractive opportunity set, underpinned by stable home prices, low loan-to-value ratios, and historically low delinquency rates. Supply-demand dynamics remain favorable, with limited new issuance and minimal refinancing risk given the high proportion of borrowers locked into low mortgage rates.

Within CMBS, fundamentals remain resilient, particularly in higher-quality segments. Improving sentiment and stable property-level performance support selective opportunities in hospitality, logistics, storage, and high-quality multifamily assets. Dispersion across property types and geographies continues to increase, reinforcing the importance of selectivity and a focus on single-asset, single-borrower (SASB) structures.

We also remain constructive on Danish covered bonds, where defensive characteristics, strong legal frameworks, and attractive USD-hedged yields continue to support relative value.

Broad Markets Fixed Income Team

Our team provides exposure to what we consider the best ideas in fixed income. Leveraging the expertise of our specialized teams, we use a team-based, rigorous and disciplined process that seeks out superior and repeatable results.

Risk Considerations
Diversification neither assures a profit nor guarantees against loss in a declining market.

There is no assurance that a portfolio will achieve its investment objective. Portfolios are subject to market risk, which is the possibility that the market values of securities owned by the portfolio will decline and that the value of portfolio shares may therefore be less than what you paid for them. Market values can change daily due to economic and other events (e.g., natural disasters, health crises, terrorism, conflicts, and social unrest) that affect markets, countries, companies, or governments. It is difficult to predict the timing, duration, and potential adverse effects (e.g., portfolio liquidity) of events. Accordingly, you can lose money investing in a portfolio. Fixed-income securities are subject to the ability of an issuer to make timely principal and interest payments (credit risk), changes in interest rates (interest rate risk), the creditworthiness of the issuer and general market liquidity (market risk). In a rising interest-rate environment, bond prices may fall and may result in periods of volatility and increased portfolio redemptions. In a declining interest-rate environment, the portfolio may generate less income. Longer-term securities may be more sensitive to interest rate changes. Certain U.S. government securities purchased by the strategy, such as those issued by Fannie Mae and Freddie Mac, are not backed by the full faith and credit of the U.S. It is possible that these issuers will not have the funds to meet their payment obligations in the future. Public bank loans are subject to liquidity risk and the credit risks of lower-rated securities. High-yield securities (junk bonds) are lower-rated securities that may have a higher degree of credit and liquidity risk. Sovereign debt securities are subject to default risk. Mortgage- and asset-backed securities are sensitive to early prepayment risk and a higher risk of default and may be hard to value and difficult to sell (liquidity risk). They are also subject to credit, market, and interest rate risks. The currency market is highly volatile. Prices in these markets are influenced by, among other things, changing supply and demand for a particular currency; trade; fiscal, money and domestic or foreign exchange control programs and policies; and changes in domestic and foreign interest rates. Investments in foreign markets entail special risks such as currency, political, economic and market risks. The risks of investing in emerging market countries are greater than the risks generally associated with foreign investments. Derivative instruments may disproportionately increase losses and have a significant impact on performance. They also may be subject to counterparty, liquidity, valuation, and correlation and market risks. Restricted and illiquid securities may be more difficult to sell and value than publicly traded securities (liquidity risk). Due to the possibility that prepayments will alter the cash flows on collateralized mortgage obligations (CMOs), it is not possible to determine in advance their final maturity date or average life. In addition, if the collateral securing the CMOs or any third-party guarantees are insufficient to make payments, the portfolio could sustain a loss.

DEFINITIONS
Basis point (bp): One basis point = 0.01%.

INDEX DEFINITIONS
The indexes shown in this report are not meant to depict the performance of any specific investment, and the indexes shown do not include any expenses, fees, or sales charges, which would lower performance. The indexes shown are unmanaged and should not be considered an investment. It is not possible to invest directly in an index.

“Bloomberg®” and the Bloomberg Index/Indices used are service marks of Bloomberg Finance L.P. and its affiliates and have been licensed for use for certain purposes by Morgan Stanley Investment Management (MSIM). Bloomberg is not affiliated with MSIM, does not approve, endorse, review, or recommend any product, and does not guarantee the timeliness, accurateness, or completeness of any data or information relating to any product.

The Bloomberg Euro Aggregate Corporate Index (Bloomberg Euro IG Corporate) is an index designed to reflect the performance of the euro-denominated investment-grade corporate bond market.

The Bloomberg Global Aggregate Corporate Index is the corporate component of the Bloomberg Global Aggregate index, which provides a broad-based measure of the global investment-grade fixed income markets.

The Bloomberg US Corporate High Yield Index measures the market of USD-denominated, non-investment grade, fixed-rate, taxable corporate bonds. Securities are classified as high yield if the middle rating of Moody’s, Fitch, and S&P is Ba1/BB+/BB+ or below. The index excludes emerging market debt.

The Bloomberg US Corporate Index is a broad-based benchmark that measures the investment grade, fixed-rate, taxable, corporate bond market.

The Bloomberg US Mortgage-Backed Securities (MBS) Index tracks agency mortgage-backed pass-through securities (both fixed-rate and hybrid ARM) guaranteed by Ginnie Mae (GNMA), Fannie Mae (FNMA) and Freddie Mac (FHLMC). The index is constructed by grouping individual TBA-deliverable MBS pools into aggregates or generics based on program, coupon, and vintage. Introduced in 1985, the GNMA, FHLMC and FNMA fixed-rate indexes for 30- and 15-year securities were backdated to January 1976, May 1977, and November 1982, respectively. In April 2007, agency hybrid adjustable-rate mortgage (ARM) pass-through securities were added to the index.

Consumer Price Index (CPI) is a measure that examines the weighted average of prices of a basket of consumer goods and services, such as transportation, food, and medical care.

Euro vs. USD—Euro total return versus U.S. dollar.

German 10YR bonds—Germany Benchmark 10-Year Datastream Government Index; Japan 10YR government bonds—Japan Benchmark 10-Year Datastream Government Index; and 10YR US Treasury—US Benchmark 10-Year Datastream Government Index.

The ICE BofAML European Currency High-Yield Constrained Index (ICE BofAML Euro HY constrained) is designed to track the performance of euro- and British pound sterling-denominated below investment-grade corporate debt publicly issued in the Eurobond, sterling.

The ICE BofAML US Mortgage-Backed Securities (ICE BofAML US Mortgage Master) Index tracks the performance of US dollar-denominated, fixed-rate and hybrid residential mortgage pass-through securities publicly issued by US agencies in the US domestic market.

The ICE BofAML US High Yield Master II Constrained Index (ICE BofAML US High Yield) is a market value-weighted index of all domestic and Yankee high-yield bonds, including deferred-interest bonds and payment-in-kind securities. Its securities have maturities of one year or more and a credit rating lower than BBB-/Baa3 but are not in default.

The ISM Manufacturing Index is based on surveys of more than 300 manufacturing firms by the Institute of Supply Management. The ISM Manufacturing Index monitors employment, production inventories, new orders, and supplier deliveries. A composite diffusion index is created that monitors conditions in national manufacturing based on the data from these surveys.

Italy 10-Year Government Bonds—Italy Benchmark 10-Year Datastream Government Index.

The JP Morgan CEMBI Broad Diversified Index is a global, liquid corporate emerging markets benchmark that tracks US-denominated corporate bonds issued by emerging markets entities.

The JPMorgan Government Bond Index—emerging markets (JPM local EM debt) tracks local currency bonds issued by emerging market governments. The index is positioned as the investable benchmark that includes only those countries that are accessible by most of the international investor base (excludes China and India as of September 2013).

The JPMorgan Government Bond Index Emerging Markets (JPM External EM Debt) tracks local currency bonds issued by emerging market governments. The index is positioned as the investable benchmark that includes only those countries that are accessible by most of the international investor base (excludes China and India as of September 2013).

The JP Morgan Emerging Markets Bond Index Global (EMBI Global) tracks total returns for traded external debt instruments in the emerging markets and is an expanded version of the EMBI+. As with the EMBI+, the EMBI Global includes US dollar-denominated Brady bonds, loans, and Eurobonds with an outstanding face value of at least $500 million.

The JP Morgan GBI-EM Global Diversified Index is a market-capitalization weighted, liquid global benchmark for US-dollar corporate emerging market bonds representing Asia, Latin America, Europe, and the Middle East/Africa.

JPY vs. USD—Japanese yen total return versus US dollar.

The Markit ITraxx Europe Index comprises 125 equally weighted credit default swaps on investment grade European corporate entities, distributed among 4 sub-indices: Financials (Senior & Subordinated), Non-Financials and HiVol.

The Nikkei 225 Index (Japan Nikkei 225) is a price-weighted index of Japan’s top 225 blue-chip companies on the Tokyo Stock Exchange.

The MSCI AC Asia ex-Japan Index (MSCI Asia ex-Japan) captures large- and mid-cap representation across two of three developed markets countries (excluding Japan) and eight emerging markets countries in Asia.

The MSCI All Country World Index (ACWI, MSCI global equities) is a free float-adjusted market capitalization weighted index designed to measure the equity market performance of developed and emerging markets. The term “free float” represents the portion of shares outstanding that are deemed to be available for purchase in the public equity markets by investors. The performance of the Index is listed in US dollars and assumes reinvestment of net dividends.

MSCI Emerging Markets Index (MSCI emerging equities) captures large- and mid-cap representation across 23 emerging markets (EM) countries.

The MSCI World Index (MSCI developed equities) captures large and mid-cap representation across 23 developed market (DM) countries.

Purchasing Managers Index (PMI) is an indicator of the economic health of the manufacturing sector.

The Refinitiv Convertible Global Focus USD Hedged Index is a market weighted index with a minimum size for inclusion of $500 million (US), 200 million (Europe), 22 billion Yen, and $275 million (Other) of Convertible Bonds with an Equity Link.

The Russell 2000® Index is an index that measures the performance of the 2,000 smallest companies in the Russell 3000 Index.

The S&P 500® Index (US S&P 500) measures the performance of the large-cap segment of the US equities market, covering approximately 75 percent of the US equities market. The index includes 500 leading companies in leading industries of the U.S. economy.

S&P CoreLogic Case-Shiller US National Home Price NSA Index seeks to measure the value of residential real estate in 20 major US metropolitan areas: Atlanta, Boston, Charlotte, Chicago, Cleveland, Dallas, Denver, Detroit, Las Vegas, Los Angeles, Miami, Minneapolis, New York, Phoenix, Portland, San Diego, San Francisco, Seattle, Tampa and Washington, D.C.

The S&P/LSTA US Leveraged Loan 100 Index (S&P/LSTA Leveraged Loan Index) is designed to reflect the performance of the largest facilities in the leveraged loan market.

The S&P GSCI Copper Index (Copper), a sub-index of the S&P GSCI, provides investors with a reliable and publicly available benchmark for investment performance in the copper commodity market.

The S&P GSCI Softs (GSCI soft commodities) Index is a sub-index of the S&P GSCI that measures the performance of only the soft commodities, weighted on a world production basis. In 2012, the S&P GSCI Softs Index included the following commodities: coffee, sugar, cocoa, and cotton.

Spain 10-Year Government Bonds—Spain Benchmark 10-Year Datastream Government Index.

The Thomson Reuters Convertible Global Focus USD Hedged Index is a market weighted index with a minimum size for inclusion of $500 million (US), 200 million euro (Europe), 22 billion yen, and $275 million (Other) of convertible bonds with an equity link.

U.K. 10YR government bonds—U.K. Benchmark 10-Year Datastream Government Index. For the following Datastream government bond indexes, benchmark indexes are based on single bonds. The bond chosen for each series is the most representative bond available for the given maturity band at each point in time. Benchmarks are selected according to the accepted conventions within each market. Generally, the benchmark bond is the latest issue within the given maturity band; consideration is also given to yield, liquidity, issue size and coupon.

The US Dollar Index (DXY) is an index of the value of the United States dollar relative to a basket of foreign currencies, often referred to as a basket of US trade partners’ currencies.

The Chicago Board Options Exchange (CBOE) Market Volatility (VIX) Index shows the market’s expectation of 30-day volatility.

There is no guarantee that any investment strategy will work under all market conditions, and each investor should evaluate their ability to invest for the long-term, especially during periods of downturn in the market.

A separately managed account may not be appropriate for all investors. Separate accounts managed according to the particular strategy may include securities that may not necessarily track the performance of a particular index. Please consider the investment objectives, risks and fees of the Strategy carefully before investing. A minimum asset level is required. For important information about the investment managers, please refer to Form ADV Part 2.

The views and opinions and/or analysis expressed are those of the author or the investment team as of the date of preparation of this material and are subject to change at any time without notice due to market or economic conditions and may not necessarily come to pass. Furthermore, the views will not be updated or otherwise revised to reflect information that subsequently becomes available or circumstances existing, or changes occurring, after the date of publication. The views expressed do not reflect the opinions of all investment personnel at Morgan Stanley Investment Management (MSIM) and its subsidiaries and affiliates (collectively “the Firm”) and may not be reflected in all the strategies and products that the Firm offers.

Forecasts and/or estimates provided herein are subject to change and may not actually come to pass. Information regarding expected market returns and market outlooks is based on the research, analysis and opinions of the authors or the investment team. These conclusions are speculative in nature, may not come to pass and are not intended to predict the future performance of any specific strategy or product the Firm offers. Future results may differ significantly depending on factors such as changes in securities or financial markets or general economic conditions.

This material has been prepared on the basis of publicly available information, internally developed data and other third-party sources believed to be reliable. However, no assurances are provided regarding the reliability of such information and the Firm has not sought to independently verify information taken from public and third-party sources.

This material is a general communication, which is not impartial, and all information provided has been prepared solely for informational and educational purposes and does not constitute an offer or a recommendation to buy or sell any particular security or to adopt any specific investment strategy. The information herein has not been based on a consideration of any individual investor circumstances and is not investment advice, nor should it be construed in any way as tax, accounting, legal or regulatory advice. To that end, investors should seek independent legal and financial advice, including advice as to tax consequences, before making any investment decision.

Charts and graphs provided herein are for illustrative purposes only. Past performance is no guarantee of future results.

The indexes are unmanaged and do not include any expenses, fees, or sales charges. It is not possible to invest directly in an index. Any index referred to herein is the intellectual property (including registered trademarks) of the applicable licensor. Any product based on an index is in no way sponsored, endorsed, sold, or promoted by the applicable licensor and it shall not have any liability with respect thereto.

This material is not a product of Morgan Stanley’s Research Department and should not be regarded as a research material or a recommendation.

The Firm has not authorized financial intermediaries to use and to distribute this material unless such use and distribution is made in accordance with applicable law and regulation. Additionally, financial intermediaries are required to satisfy themselves that the information in this material is appropriate for any person to whom they provide this material in view of that person’s circumstances and purpose. The Firm shall not be liable for, and accepts no liability for, the use or misuse of this material by any such financial intermediary.

This material may be translated into other languages. Where such a translation is made this English version remains definitive. If there are any discrepancies between the English version and any version of this material in another language, the English version shall prevail.

The whole or any part of this material may not be directly or indirectly reproduced, copied, modified, used to create a derivative work, performed, displayed, published, posted, licensed, framed, distributed, or transmitted or any of its contents disclosed to third parties without the Firm’s express written consent. This material may not be linked to unless such hyperlink is for personal and non-commercial use. All information contained herein is proprietary and is protected under copyright and other applicable law.

Eaton Vance is part of Morgan Stanley Investment Management. Morgan Stanley Investment Management is the asset management division of Morgan Stanley.

DISTRIBUTION
This material is only intended for and will only be distributed to persons resident in jurisdictions where such distribution or availability would not be contrary to local laws or regulations.

MSIM, the asset management division of Morgan Stanley (NYSE: MS), and its affiliates have arrangements in place to market each other’s products and services. Each MSIM affiliate is regulated as appropriate in the jurisdiction it operates. MSIM’s affiliates are: Calvert Research and Management, Eaton Vance Management, Parametric Portfolio Associates LLC, Parametric SAS, and Atlanta Capital Management LLC.

This material has been issued by any one or more of the following entities:

EMEA
This material is for Professional Clients/Accredited Investors only.

In the EU, MSIM materials are issued by MSIM Fund Management (Ireland) Limited (“FMIL”). FMIL is regulated by the Central Bank of Ireland and is incorporated in Ireland as a private company limited by shares with company registration number 616661 and has its registered address at 24-26 City Quay, Dublin 2, DO2 NY19, Ireland.

Outside the EU, MSIM materials are issued by Morgan Stanley Investment Management Limited (MSIM Ltd) is authorised and regulated by the Financial Conduct Authority. Registered in England. Registered No. 1981121. Registered Office: 25 Cabot Square, Canary Wharf, London E14 4QA.

In Switzerland, MSIM materials are issued by Morgan Stanley & Co. International plc, London (Zurich Branch) Authorised and regulated by the Eidgenössische Finanzmarktaufsicht (“FINMA”). Registered Office: Beethovenstrasse 33, 8002 Zurich, Switzerland.

Italy: MSIM FMIL (Milan Branch), (Sede Secondaria di Milano) Palazzo Serbelloni Corso Venezia, 16 20121 Milano, Italy. The Netherlands: MSIM FMIL (Amsterdam Branch), Rembrandt Tower, 11th Floor Amstelplein 1 1096HA, Netherlands. France: MSIM FMIL (Paris Branch), 61 rue de Monceau 75008 Paris, France. Spain: MSIM FMIL (Madrid Branch), Calle Serrano 55, 28006, Madrid, Spain. Germany: MSIM FMIL Frankfurt Branch, Große Gallusstraße 18, 60312 Frankfurt am Main, Germany (Gattung: Zweigniederlassung (FDI) gem. § 53b KWG). Denmark: MSIM FMIL (Copenhagen Branch), Gorrissen Federspiel, Axel Towers, Axeltorv2, 1609 Copenhagen V, Denmark.

MIDDLE EAST
Dubai International Financial Centre
: This information does not constitute or form part of any offer to issue or sell, or any solicitation of any offer to subscribe for or purchase, any securities or investment products in the UAE (including the Dubai International Financial Centre and the Abu Dhabi Global Market) and accordingly should not be construed as such. Furthermore, this information is being made available on the basis that the recipient acknowledges and understands that the entities and securities to which it may relate have not been approved, licensed by or registered with the UAE Central Bank, the Dubai Financial Services Authority, the UAE Securities and Commodities Authority, the Financial Services Regulatory Authority or any other relevant licensing authority or government agency in the UAE. The content of this report has not been approved by or filed with the UAE Central Bank, the Dubai Financial Services Authority, the UAE Securities and Commodities Authority or the Financial Services Regulatory Authority.

Abu Dhabi Global Market (“ADGM”): This material is sent strictly within the context of, and constitutes, an Exempt Communication. This material relates to (strategy) which is not subject to any form of regulation or approval by the Financial Services Regulatory Authority of the Abu Dhabi Global Market (the “FSRA”).

Saudi Arabia
This financial promotion was issued and approved for use in Saudi Arabia by Morgan Stanley Saudi Arabia, Al Rashid Tower, Kings Sand Street, Riyadh, Saudi Arabia, authorized and regulated by the Capital Market Authority license number 06044-37.

US
NOT FDIC INSURED. OFFER NO BANK GUARANTEE. MAY LOSE VALUE. NOT INSURED BY ANY FEDERAL GOVERNMENT AGENCY. NOT A DEPOSIT.

Latin America (Brazil, Chile Colombia, Mexico, Peru, and Uruguay)
This material is for use with an institutional investor or a qualified investor only. All information contained herein is confidential and is for the exclusive use and review of the intended addressee and may not be passed on to any third party. This material is provided for informational purposes only and does not constitute a public offering, solicitation, or recommendation to buy or sell for any product, service, security and/or strategy. A decision to invest should only be made after reading the strategy documentation and conducting in-depth and independent due diligence.

ASIA PACIFIC
Hong Kong
: This document has been issued by Morgan Stanley Asia Limited, CE No. AAD291, for use in Hong Kong and shall only be made available to “professional investors” as defined under the Securities and Futures Ordinance of Hong Kong (Cap 571). The contents of this document have not been reviewed nor approved by any regulatory authority including the Securities and Futures Commission in Hong Kong. Accordingly, save where an exemption is available under the relevant law, this document shall not be issued, circulated, distributed, directed at, or made available to, the public in Hong Kong. Singapore: This material is disseminated in Singapore by Morgan Stanley Investment Management Company, Registration No. 199002743C. This material should not be considered to be the subject of an invitation for subscription or purchase, whether directly or indirectly, to the public or any member of the public in Singapore other than (i) to an institutional investor under section 304 of the Securities and Futures Act, Chapter 289 of Singapore (“SFA”), (ii) to a “relevant person” (which includes an accredited investor) pursuant to section 305 of the SFA, and such distribution is in accordance with the conditions specified in section 305 of the SFA; or (iii) otherwise pursuant to, and in accordance with the conditions of, any other applicable provision of the SFA. This material has not been reviewed by the Monetary Authority of Singapore. Australia: This material is provided by Morgan Stanley Investment Management (Australia) Pty Ltd ABN 22122040037, AFSL No. 314182 and its affiliates and does not constitute an offer of interests. Morgan Stanley Investment Management (Australia) Pty Limited arranges for MSIM affiliates to provide financial services to Australian wholesale clients. This material will not be lodged with the Australian Securities and Investments Commission.

Japan
For professional investors, this material is circulated or distributed solely for informational purposes. For non-professional investors, this material is provided in connection with Morgan Stanley Investment Management (Japan) Co., Ltd. (“MSIMJ”)’s business with respect to discretionary investment management agreements (“IMA”) and investment advisory agreements (“IAA”). This does not constitute a recommendation or solicitation of transactions nor offers any particular financial instruments. Under an IMA, with respect to the management of client assets, the client prescribes basic management policies in advance and commissions MSIMJ to make all investment decisions based on an analysis of the value, etc. of the securities, and MSIMJ accepts such commission. The client shall delegate to MSIMJ the authorities necessary to make such investment decisions. MSIMJ exercises these delegated authorities accordingly, and the client shall not make individual instructions. All investment profits and losses belong to the clients; principal is not guaranteed. Please consider the investment objectives and nature of risks before investing. As an investment advisory fee for an IAA or an IMA, the amount of assets subject to the contract multiplied by a certain rate (the upper limit is 2.20% per annum (including tax)) shall be incurred in proportion to the contract period. For some strategies, a contingency fee may be incurred in addition to the fee mentioned above. Indirect charges also may be incurred, such as brokerage commissions for underlying securities. Since these charges and expenses vary by contract and other factors, MSIMJ cannot present the rates, upper limits, etc. in advance. All clients should read thoroughly the Documents Provided Prior to the Conclusion of a Contract carefully before executing an agreement. This material is distributed in Japan by MSIMJ, Registered No. 410 (Director of Kanto Local Finance Bureau (Financial Instruments Firms)), Membership: the Japan Securities Dealers Association, the Investment Management Association of Japan and the Type II Financial Instruments Firms Association.